


pH-EC graph
greystoke
15 years ago
Sort by:Oldest
Comment (1)
Related Stories
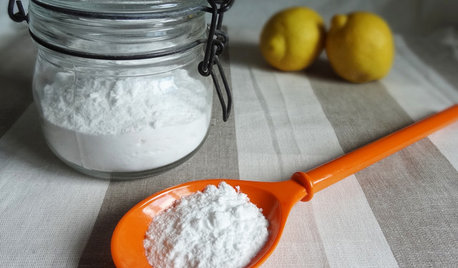
HOUSEKEEPINGBaking Soda: The Amazing All-Natural Cleanser You Already Own
Battle grime, banish odors and freshen clothes with this common nontoxic cupboard staple
Full Story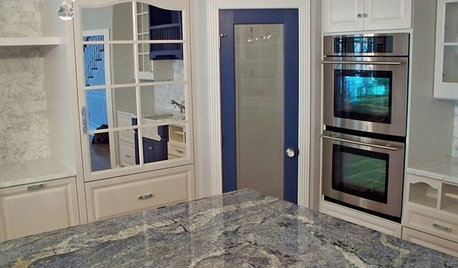
KITCHEN COUNTERTOPSKitchen Counters: Granite, Still a Go-to Surface Choice
Every slab of this natural stone is one of a kind — but there are things to watch for while you're admiring its unique beauty
Full Story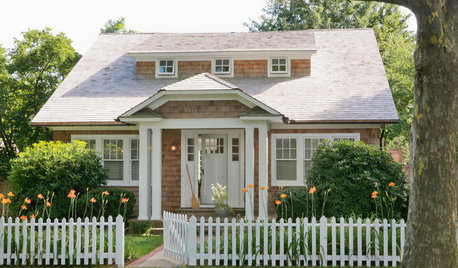
DECORATING STYLESOutfit a Cottage-Style Remodel, Top to Bottom
If you're renovating with a cottage look in mind, these fixtures, finishes and accessories will bring on the charm
Full Story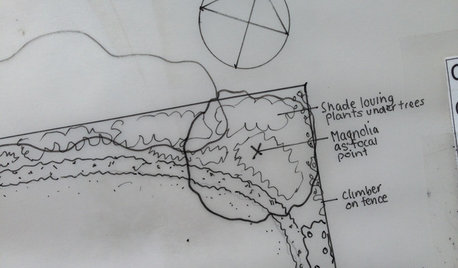
LANDSCAPE DESIGNDesign Workshop: How to Analyze Your Outdoor Site
Getting to know your site is the first step to creating a wonderful garden. Follow this 10-point checklist to get it right
Full Story
greystokeOriginal Author
Related Professionals
Surprise Landscape Architects & Landscape Designers · Alexandria Landscape Contractors · Coeur d'Alene Landscape Contractors · East Lake-Orient Park Landscape Contractors · El Mirage Landscape Contractors · Lemay Landscape Contractors · Lynchburg Landscape Contractors · Maywood Landscape Contractors · Nashua Landscape Contractors · New Braunfels Landscape Contractors · Oviedo Landscape Contractors · Parkland Landscape Contractors · Suitland Landscape Contractors · Thonotosassa Landscape Contractors · Norridge Landscape Contractors