

Reading a spectral power distribution graph.
gnbrews
15 years ago
Related Stories
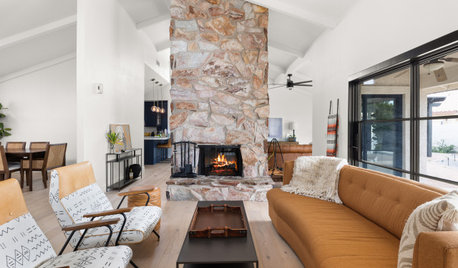
DECORATING GUIDESHow to Get Your Furniture Arrangement Right
Follow these 10 basic layout rules for a polished, pulled-together look in any room
Full Story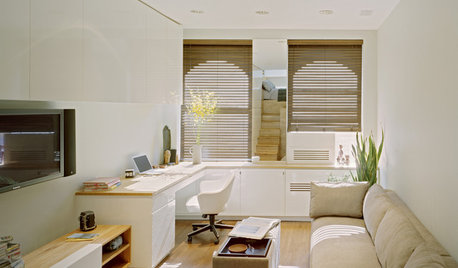
SMALL HOMESCan You Live a Full Life in 220 Square Feet?
Adjusting mind-sets along with furniture may be the key to happiness for tiny-home dwellers
Full Story
SAVING WATERHouzz Call: Are You Letting Go of Your Lawn?
Many facing a drought are swapping turf for less thirsty plantings. If you’re one of them, we’d like to hear about it
Full StorySponsored
More Discussions
lermer
Related Professionals
Glassmanor Landscape Architects & Landscape Designers · Alexandria Landscape Contractors · Berkeley Heights Landscape Contractors · Farmington Landscape Contractors · Gallatin Landscape Contractors · Shoreview Landscape Contractors · South Portland Landscape Contractors · Weslaco Landscape Contractors · Four Corners Landscape Contractors · Cherry Hill Fence Contractors · Tacoma Fence Contractors · Torrance Fence Contractors · Austin Roofing & Gutters · Boca Raton Roofing & Gutters · Kent Roofing & Gutters