

Excel anyone?
WendyB 5A/MA
14 years ago
Related Stories

DECORATING GUIDESThe Cure for Houzz Envy: Dining Room Touches Anyone Can Do
Get a decorator-style dining room on the cheap with inexpensive artwork, secondhand furniture and thoughtful accessories
Full Story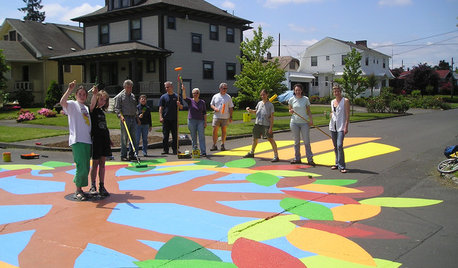
COMMUNITYCommunity Building Just About Anyone Can Do
Strengthen neighborhoods and pride of place by setting up more public spaces — even small, temporary ones can make a big difference
Full Story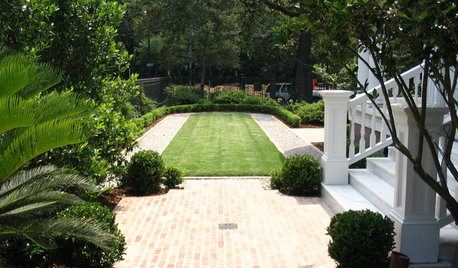
GARDENING AND LANDSCAPINGBocce, Anyone? Toss Some Popular Games Into Your Yard Plans
Score points for entertaining with a yard set up for lawn bowling, croquet, chess and more
Full Story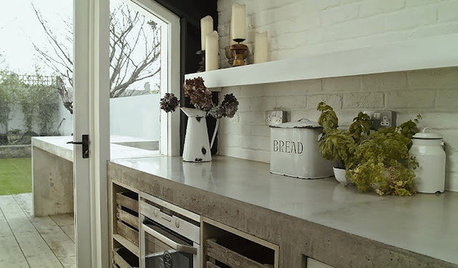
KITCHEN COUNTERTOPSKitchen Counters: Concrete, the Nearly Indestructible Option
Infinitely customizable and with an amazingly long life span, concrete countertops are an excellent option for any kitchen
Full Story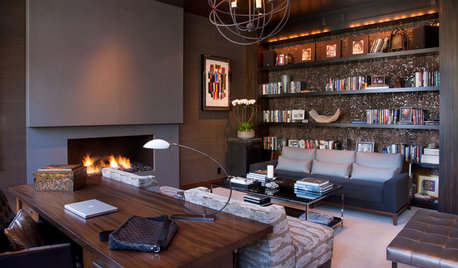
DECORATING GUIDES8 Qualities of Great Interior Design
We identify some elusive attributes of excellent interiors to get you past "I know it when I see it"
Full Story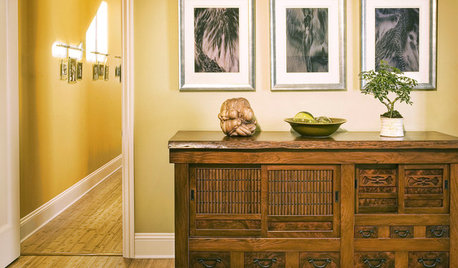
STORAGEAdd Asian Flair to Your Home with Tansu Style Cabinets
Naturally Beautiful Japanese Cabinets Create Excellent Storage for Asian and Eclectic Spaces
Full Story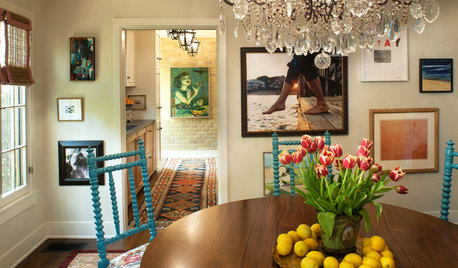
DECORATING GUIDESHow to Savor Your Beautifully Imperfect Home
Hardly anyone escapes home design envy. These strategies can help you appreciate your home for all it offers you right now
Full Story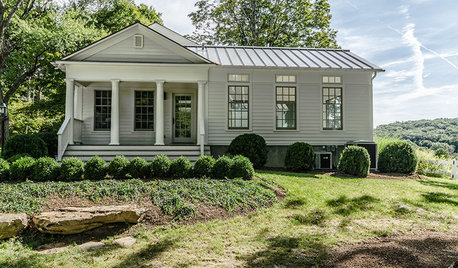
HOUZZ TOURSHouzz Tour: A Revolutionary Renovation in Connecticut
A 200-year-old farmhouse retains elements of its past, like reclaimed wood, yet feels decidedly modern. Yoga, anyone?
Full Story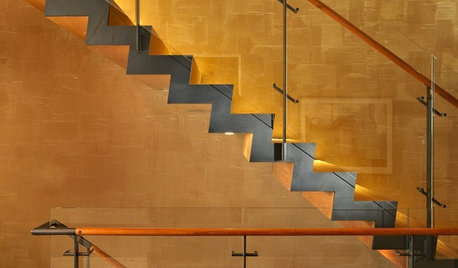
COLORColor Guide: How to Work With Gold
It's OK to be a gold digger — this timeless color adds a rich glow to walls, furnishings and home decor that anyone would covet
Full Story
COFFEE WITH AN ARCHITECTTake a Breath, Relax — It's Just Design
Some prescriptions for some perspective, by an architect who has a hard time letting go
Full Story

bill_ri_z6b
tree_oracle
Related Professionals
Danbury Landscape Architects & Landscape Designers · Bridgetown Landscape Architects & Landscape Designers · Beachwood Landscape Architects & Landscape Designers · Tomball Landscape Architects & Landscape Designers · Bedford Heights Landscape Contractors · Canyon Lake Landscape Contractors · Lynn Landscape Contractors · Pahrump Landscape Contractors · Clemmons Decks, Patios & Outdoor Enclosures · Estero Decks, Patios & Outdoor Enclosures · Grand Rapids Decks, Patios & Outdoor Enclosures · Layton Decks, Patios & Outdoor Enclosures · Monroe Decks, Patios & Outdoor Enclosures · St. Louis Decks, Patios & Outdoor Enclosures · Verona Decks, Patios & Outdoor Enclosureslschibley
WendyB 5A/MAOriginal Author
prairiemoon2 z6b MA
WendyB 5A/MAOriginal Author
prairiemoon2 z6b MA
WendyB 5A/MAOriginal Author
prairiemoon2 z6b MA
WendyB 5A/MAOriginal Author
prairiemoon2 z6b MA
runktrun
WendyB 5A/MAOriginal Author
prairiemoon2 z6b MA
WendyB 5A/MAOriginal Author
WendyB 5A/MAOriginal Author
prairiemoon2 z6b MA
WendyB 5A/MAOriginal Author
prairiemoon2 z6b MA
WendyB 5A/MAOriginal Author
prairiemoon2 z6b MA
WendyB 5A/MAOriginal Author
prairiemoon2 z6b MA
WendyB 5A/MAOriginal Author
prairiemoon2 z6b MA
WendyB 5A/MAOriginal Author
prairiemoon2 z6b MA
WendyB 5A/MAOriginal Author
prairiemoon2 z6b MA
WendyB 5A/MAOriginal Author
prairiemoon2 z6b MA