


The best (USDA) zone map I've ever seen!
Skybird - z5, Denver, Colorado
13 years ago
Related Stories
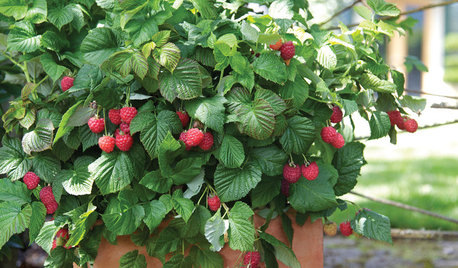
CONTAINER GARDENSPatio-Perfect Berry Bushes Like You’ve Never Seen
Small enough for pots but offering abundant fruit, these remarkable bred berries are a boon for gardeners short on space
Full Story
FEEL-GOOD HOME12 Very Useful Things I've Learned From Designers
These simple ideas can make life at home more efficient and enjoyable
Full Story
ENTRYWAYSRoom of the Day: The Most Flexible Foyer Ever
With zones for a bicycle, meditation and storage, and a hand-painted concrete floor, this entry mixes practicality and cool good looks
Full Story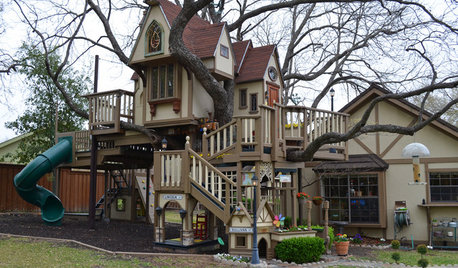
MOST POPULARThe Most Incredible Kids' Tree House You'll Ever See?
Duck your head to enter this unforgettable Dallas wonderwork, lovingly crafted with imaginative delights
Full Story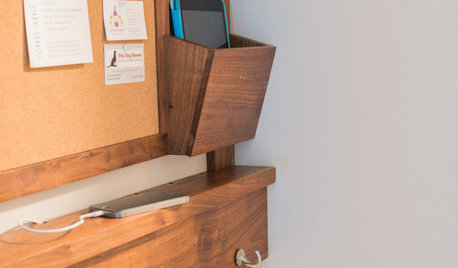
THE HARDWORKING HOMEA New Drop Zone Keeps the Clutter at Bay
The Hardworking Home: A clever wall-mounted station for keys, phones and more helps a family stay organized
Full Story
WALL TREATMENTSA Tiny Powder Room Gets a Map-tastic Look
Creative cartography adds cheer and personality to the walls of a compact half bath
Full Story
HOUZZ TOURSMy Houzz: An Artist Maps Out Her Own Haven of Happiness
A 1960s Australian vacation lodge is home to an artist-curator whose vintage collectibles fit beautifully in the seaside abode
Full Story
GARDENING GUIDESHow to Find the Right Native Plants for Your Yard
Find plant maps, sale sites and guides that make going native in the garden easier than ever
Full Story
FALL GARDENINGMake This Fall’s Garden the Best Ever
Learn the most important tip for preventing buyer’s remorse, plus get more valuable buying and planting advice
Full Story
MY HOUZZMy Houzz: A Seattle Bungalow Goes From Flip to Happily-Ever-After Home
Once intended for a quick sale, this 1930s house now bears witness to its remodelers’ love and marriage
Full Story
treebarb Z5 Denver
digit
Related Professionals
Beavercreek Landscape Architects & Landscape Designers · Alexandria Landscape Contractors · Deer Park Landscape Contractors · Dickinson Landscape Contractors · Fort Atkinson Landscape Contractors · Gresham Landscape Contractors · Hendersonville Landscape Contractors · Mastic Beach Landscape Contractors · Peachtree City Landscape Contractors · Pine Hills Landscape Contractors · Uxbridge Landscape Contractors · Washington Landscape Contractors · Markham Landscape Contractors · Lauderdale Lakes Landscape Contractors · Yucca Valley Solar Energy Systemsjillybillyg
mtny
Dan _Staley (5b Sunset 2B AHS 7)
mtny
Dan _Staley (5b Sunset 2B AHS 7)
thralen
dsieber
Skybird - z5, Denver, ColoradoOriginal Author
billie_ladybug
keen101
jnfr
kimka
jnfr