


New Hardiness Map published
Lin barkingdogwoods
12 years ago
Sort by:Oldest
Comments (13)
Related Stories
GARDENING GUIDESHow to Find the Right Plants for Your Garden
Break free from choosing plants by cold-hardiness zones for a beautiful landscape that thrives year-round
Full Story
GARDENING GUIDES10 Top Native Plants for the U.S. Southeast
For a low-maintenance and wildlife-friendly landscape, use Southern natives that withstand heat and humidity
Full Story
DECORATING GUIDESSo Your Style Is: Black, White and Read All Over
Make headlines at home with newsworthy decor
Full Story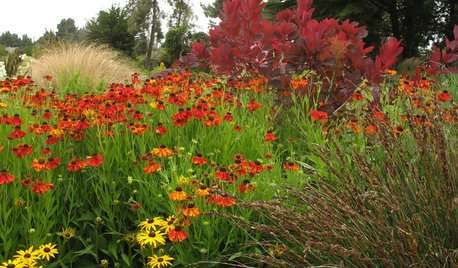
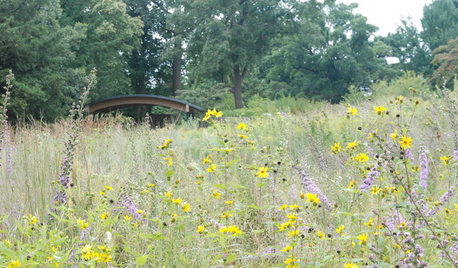
PLANTING IDEASWant a More Colorful, Natural Garden? Try a Perennial Meadow
Spend less time tending and more time taking in the sights by improving on Victorian and prairie garden designs
Full Story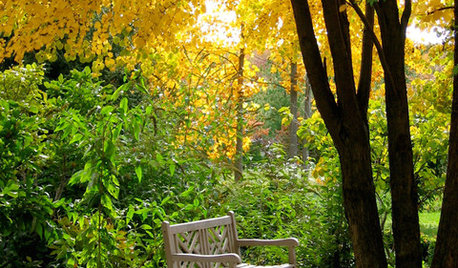
GARDENING GUIDES8 Plants for a Deliciously Fragrant Fall Garden
Scent the autumn air with the perfume of caramel corn, honey and spices by adding these intoxicating plants to your landscape
Full Story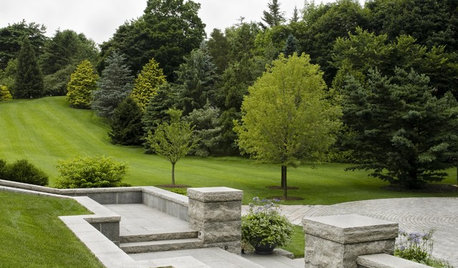
LIFEWhy We Want a House With a Great View
Research shows that just looking at nature has powerful mental benefits. Here's how to get a boost — with or without a million-dollar view
Full Story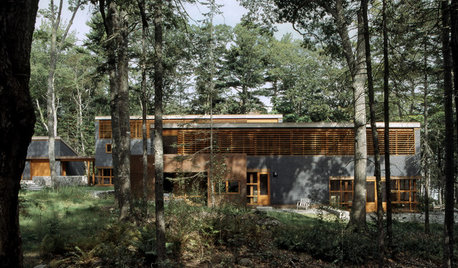
ARCHITECTURE'Houses of Maine' Puts Modernism in Its Place — in Nature
Set in the meadows and woods of Maine, the homes in this book give modern architecture a natural context
Full Story
HOME TECHHome Tech: Where Is My Robot Housekeeper?
We haven't mastered the all-purpose humanoid house cleaner, but these gadgets make quick work of chores
Full Story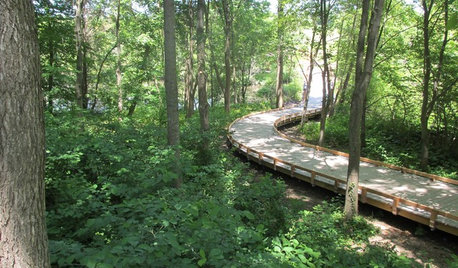
INSPIRING GARDENSWhat We Can Learn From Longwood Gardens’ New Meadow
Sustainability, ecology, native plant communities ... this public garden is brimming with lessons on horticulture for home gardeners
Full Story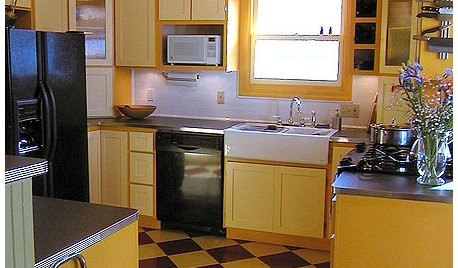
KITCHEN DESIGNKitchen Remodel Costs: 3 Budgets, 3 Kitchens
What you can expect from a kitchen remodel with a budget from $20,000 to $100,000
Full StoryMore Discussions

carrie751
ogrose_tx
Related Professionals
Foothill Ranch Landscape Architects & Landscape Designers · Marco Island Landscape Architects & Landscape Designers · Peabody Landscape Contractors · Coram Landscape Contractors · Fair Oaks Landscape Contractors · Melrose Landscape Contractors · Mendota Heights Landscape Contractors · Mission Landscape Contractors · Nashua Landscape Contractors · National City Landscape Contractors · Placerville Landscape Contractors · Littleton Window Contractors · Aventura Window Contractors · Indian Creek Window Contractors · San Ramon Window ContractorsPKponder TX Z7B
Lynn Marie
Lin barkingdogwoodsOriginal Author
chickadee_42us
chickadee_42us
seamommy
cynthianovak
melvalena
carrie751
wantonamara Z8 CenTex
Lin barkingdogwoodsOriginal Author